FINANCIAL SUMMARY
The following is a summary of Whirlpool Corporation’s financial condition and results of operations for 2010, 2009 and 2008. For a more complete understanding of our financial condition and results, this summary should be read together with Whirlpool Corporation’s Consolidated Financial Statements and related notes, and “Management’s Discussion and Analysis.” This information appears in the Financial Supplement to the Company’s Proxy Statement and in the Financial Supplement to the 2010 Annual Report on Form 10-K filed with the Securities and Exchange Commission, both of which are also available through the Internet at www.whirlpoolcorp.com.
ABOUT WHIRLPOOL
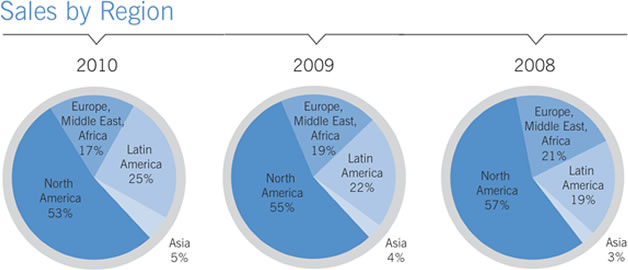
Whirlpool Corporation (“Whirlpool”) is the world’s leading manufacturer of major home appliances with revenues over $18 billion and net earnings available to Whirlpool of $619 million in 2010. We are a leading producer of major home appliances in North America and Latin America and have a significant presence in markets throughout Europe and India. We have received worldwide recognition for accomplishments in a variety of business and social efforts, including leadership, diversity, innovative product design, business ethics, social responsibility and community involvement. We conduct our business through four reportable segments, which we define based on geography. Our reportable segments consist of North America, Latin America, Europe, and Asia. Our customer base is characterized by large, sophisticated trade customers who have many choices and demand competitive products, services and prices. The charts below summarize the balance of net sales by reportable segment for 2010, 2009 and 2008, respectively:
We monitor country-specific economic factors such as gross domestic product, unemployment, consumer confidence, retail trends, housing starts and completions, sales of existing homes and mortgage interest rates as key indicators of industry demand. In addition to profitability, we also focus on country, brand, product and channel sales when assessing and forecasting financial results.
Our leading portfolio of brands includes: Whirlpool, Maytag, KitchenAid, Brastemp and Consul, each of which have annual revenues in excess of $1 billion. Our global branded consumer products strategy is to introduce innovative new products, increase customer brand loyalty, expand our presence in foreign markets, enhance our trade management platform, improve total cost and quality by expanding and leveraging our global operating platform and where appropriate, make strategic acquisitions and investments.
In addition, as we grow revenues from our core products, our strategy is to extend our core business by offering products or services that are dependent on and related to our core business and expand beyond the core into adjacent products through stand-alone businesses that leverage our core competencies and core business infrastructure.
2010 OVERVIEW
Whirlpool and the appliance industry as a whole faced significant macroeconomic challenges across much of the world in 2010. We experienced strong signs of global economic recovery during the first six months of 2010 with higher than expected demand complemented by stable currencies, input costs and appliance pricing. However, during the second half of 2010 we experienced a significant slowing in sales growth, especially in North America, increased material costs and competitive global pricing pressure. Despite these challenging market conditions, we experienced volume increases in all geographic regions compared to 2009, especially in our Latin America region where unit volumes increased more than 16% compared to 2009, and our Asia region where unit volumes increased more than 22% compared to 2009.
Competition in the home appliance industry remained intense in all global markets we serve. In addition to our traditional competitors Electrolux, General Electric, and Kenmore in North America, the emerging global competitors: LG, Bosch Siemens, Samsung and Haier, have contributed to an increasingly competitive pricing environment. We believe that our productivity and cost controls and new innovative product introductions will enhance our ability to respond to these competitive conditions.
Despite these challenging business conditions, Whirlpool’s ongoing focus on cost reductions, productivity and innovative new product launches continues to enable Whirlpool to adapt to changes in the macroeconomic environment. We experienced branded share growth in most markets we serve fueled by our consumer-relevant innovations and our key new product launches, which continue to be well-received by consumers. Consolidated net sales increased 7.4% compared to 2009 and our consolidated gross margin increased to 14.8% of net sales, an improvement of 0.8 points compared to 2009.
During the year, Whirlpool remained focused on cost reduction and productivity initiatives to offset higher material costs and on continuing to bring consumer relevant innovation to reduce the impact of the unfavorable price/mix environment.
RESULTS OF OPERATIONS
In 2010, consolidated net sales were over $18 billion and consolidated net earnings available to Whirlpool were $619 million, or $7.97 per diluted share, increasing from $328 million or $4.34 per diluted share in 2009. These results include record levels of cost productivity and favorable foreign currency which more than offset unfavorable product price/mix and higher material and oil-related costs. In addition, net earnings in 2010 includes the benefit of $225 million of BEFIEX credits recognized, compared to $69 million in 2009, and the benefit of $225 million of energy tax credits generated in the United States from the production of certain energy efficient appliances, compared to $113 million in 2009. The increase of BEFIEX credits recognized in 2010 was the result of the expiration of a sales tax holiday declared in 2009 by the Brazilian government on certain appliances in our Latin America region. During this holiday, we monetized reduced amounts in BEFIEX credits because our BEFIEX credits are monetized through the offset of sales taxes due. The sales tax holiday expired on January 31, 2010.
In 2010, several significant items also affected earnings including $93 million in antitrust settlements, compared to $56 million in 2009, a total of $78 million in product recall charges, compared to $35 million in 2009, a $53 million charge related to a Brazilian collection dispute compared to $46 million in 2009, and $62 million in curtailment gains related to a retiree healthcare plan, compared to $89 million in 2009. Global industry sales growth slowed significantly in the second half compared to the first half of the year. The overall price/mix environment became unfavorable, particularly in North America where we took pricing actions to match some aggressive competitive pricing pressure. Also, material and oil-related cost increases escalated during the second half of the year. We have recently announced price increases in many markets to address the material and oil-related cost increases.
Consolidated Net Sales
Consolidated net sales increased 7.4% compared to 2009 primarily due to higher unit shipments, higher BEFIEX credits recognized and the favorable impact of foreign currency partially offset by unfavorable product price/mix. Excluding the impact of foreign currency, consolidated net sales increased 5.3% compared to 2009. Consolidated net sales for 2009 decreased 9.6% compared to 2008 primarily due to lower unit shipments and the impact of unfavorable foreign currency. Excluding the impact of foreign currency, consolidated net sales for 2009 decreased 5.8% compared to 2008.
Significant regional trends were as follows:
- North America net sales increased 2.0% compared to 2009 primarily due to a 5.9% increase in units sold. The increase in units sold was driven by strong industry growth in the first half which slowed significantly in the second half primarily in the United States. In addition, net sales were negatively impacted by unfavorable product price/mix, including pricing actions during the second half of 2010 taken to match aggressive competitive pricing pressure, partially offset by the favorable impact of foreign currency. Excluding the impact of foreign currency, North America net sales increased 0.7% in 2010. North America net sales for 2009 decreased 11.0% compared to 2008 primarily due to a 9.5% decrease in units sold. The decline in units sold was due to decreased industry demand resulting from continued weak economies in the United States, Mexico and Canada in 2009. Additionally, net sales were negatively impacted by the unfavorable impact of foreign currency, which was partially offset by favorable product price/mix. Excluding the impact of foreign currency, North America net sales for 2009 decreased 9.4% compared to 2008.
-
Latin America net sales increased 26.7% compared to 2009 primarily due to a 16.1% increase in units sold. The increase in units sold was driven by strong industry growth in the first half which moderated somewhat in the second half of the year. In addition, net sales increased due to the favorable impact of foreign currency and higher BEFIEX credits recognized, partially offset by unfavorable product price/mix. Excluding the impact of foreign currency and higher BEFIEX credits, Latin America net sales increased 13.7% in 2010. Latin America net sales for 2009 were unchanged compared to 2008 as the unfavorable impact of foreign currency and lower BEFIEX credits recognized were fully offset by a 14.5% increase in units sold. The increase in units sold in 2009 was a result of favorable economic conditions and a sales tax holiday in Brazil. The sales tax holiday was the primary driver of the reduction of BEFIEX credits recognized. This sales tax holiday was declared by the Brazilian government on certain appliances beginning in the second quarter and extended through the remainder of 2009. During this holiday, we monetized reduced amounts of BEFIEX credits because our BEFIEX credits are monetized through the offset of sales taxes due. The sales tax holiday expired January 31, 2010. Excluding the impact of foreign currency, Latin America net sales for 2009 increased 7.1% compared to 2008.
We monetized $225 million, $69 million and $168 million of BEFIEX credits during 2010, 2009 and 2008, respectively. We expect to continue recognizing credits as they are monetized. At December 31, 2010, $540 million of these export credits remain. Future actions by the Brazilian government could limit our ability to monetize these export credits.
- Europe net sales decreased 3.3% compared to 2009, primarily due to the unfavorable impact of foreign currency and unfavorable product price/mix driven by an increasingly competitive pricing environment, partially offset by a 4.7% increase in units sold due to higher industry demand, which accelerated during the second half of 2010. Excluding the impact of foreign currency, Europe net sales increased 0.7%. Europe net sales for 2009 decreased 16.9% compared to 2008, primarily due to an 11.7% decrease in units sold due to lower appliance industry demand and the unfavorable impact of foreign currency. Excluding the impact of foreign currency, Europe net sales for 2009 decreased 11.2% compared to 2008.
- Asia net sales increased 30.6%, led by results in India and China, compared to 2009 primarily due to a 22.4% increase in units sold. Excluding the impact of foreign currency, Asia net sales increased 23.8%. Asia net sales for 2009 increased 10.3% compared to 2008 primarily due to a 20.8% increase in units sold partially offset by the impact of unfavorable foreign currency. Excluding the impact of foreign currency, Asia net sales for 2009 increased 18.4% compared to 2008.
Gross Margin
The consolidated gross margin percentage increased 0.8 points to 14.8% compared to 2009, primarily due to cost reduction initiatives, productivity improvements and higher BEFIEX credits recognized, partially offset by unfavorable product price/mix and material cost increases.
Significant regional trends were as follows:
- North America gross margin decreased compared to 2009 primarily due to unfavorable product price/mix, higher material costs, $43 million in higher product recall charges, a $45 million variance in LIFO adjustments from a $41 million reduction in 2009 due to productivity driven cost deflation to a $4 million increase in 2010 due to cost inflation, and $18 million lower postretirement curtailment gain, partially offset by continued cost reductions, improved productivity and higher volumes. North America gross margin for 2009 increased compared to 2008 primarily due to continued cost reductions and improved productivity, product price/mix and a postretirement curtailment gain totaling $80 million. Additionally, gross margin for 2009 was positively impacted by a $41 million reduction in LIFO reserves resulting from productivity driven cost deflation. These gross margin improvements were partially offset by the unfavorable impacts of lower volumes, foreign currency and $35 million in charges associated with a product recall.
- Latin America gross margin increased compared to 2009 primarily due to $156 million higher BEFIEX credits recognized, cost reductions and improved productivity, partially offset by unfavorable product price/mix. Latin America gross margin for 2009 decreased compared to 2008 primarily due to lower BEFIEX credits recognized, higher material and oil-related costs, lower product price/mix and an operating tax settlement, offset by improved productivity and $11 million of credits related to refundable energy surcharges.
- Europe gross margin increased compared to 2009 primarily due to cost reductions and improved productivity, partially offset by unfavorable product price/mix. Europe gross margin for 2009 decreased compared to 2008 primarily due to lower volumes, the unfavorable impact of foreign currency, asset sale gains and insurance proceeds totaling $14 million recognized in 2008. These decreases were partially offset by cost reductions and productivity initiatives and lower material and oil-related costs.
- Asia gross margin decreased compared to 2009 primarily due to higher material and oil-related costs and unfavorable product price/mix, partially offset by the favorable impact of foreign currency. Asia gross margin for 2009 increased compared to 2008 primarily due to continued cost reductions and improved productivity and a $3 million asset sale gain, which were partially offset by unfavorable product price/mix.
Selling, General and Administrative
Selling, general and administrative expenses as a percent of consolidated net sales decreased compared to 2009, primarily due to favorable leverage on increased net sales. Selling, general and administrative expenses increased approximately $54 million compared to 2009 in Latin America, primarily due to the unfavorable impact of foreign currency and higher infrastructure spending to support higher sales volumes. Selling, general and administrative expenses as a percent of consolidated net sales for 2009 decreased compared to 2008, primarily as a result of infrastructure cost reductions and lower brand investments.
Research and Development Costs
Research and development costs increased $27 million or 5.5% compared to 2009 to $516 million or 2.8% of consolidated net sales. In 2009, research and development costs increased $26 million or 5.6% compared to 2008 to $489 million or 2.8% of consolidated net sales. The increases in 2010 and 2009 were primarily due to increased product innovation spending.
Restructuring Costs
Restructuring initiatives resulted in charges of $74 million, $126 million and $149 million in 2010, 2009, and 2008, respectively, due to ongoing efforts to optimize our global operating platform. These charges consist primarily of charges to shift refrigeration and laundry capacity within North America and dishwasher capacity within Europe and reorganize the salaried workforce throughout Europe.
In 2008, management committed to a workforce reduction plan to reduce our employee base worldwide. In 2009 management announced changes to our North American manufacturing operations which resulted in the closure of a manufacturing facility in Evansville, Indiana in June 2010.
Interest and Sundry Income (Expense)
Interest and sundry expense increased $22 million compared to 2009 to $197 million, primarily due to higher charges relating to the compressor plea agreements of approximately $40 million, partially offset by the favorable impacts of foreign currency and higher interest income. In 2009, interest and sundry expense increased by $75 million compared to 2008 to $175 million. The increase in 2009 was primarily due to charges incurred for a Brazilian collection dispute and the compressor settlement agreement, partially offset by the favorable impacts of foreign currency.
Interest Expense
Interest expense increased $6 million compared to 2009 to $225 million, as 2009 benefited from an $8 million reduction in accrued interest as a result of an operating tax settlement. The current year also includes higher amortization of debt issuance costs, partially offset by a reduction in interest expense due to lower average debt levels and interest rates in 2010. In 2009, interest expense increased compared to 2008 primarily due to the combination of higher interest rates and higher average debt levels, partially offset by a reduction in accrued interest of $8 million as a result of entering into a special program in Brazil to settle tax liabilities.
Income Taxes
The effective income tax rate was a benefit of 10.9%, a benefit of 20.6% and a benefit of 81.7% in 2010, 2009 and 2008, respectively. The reduction in tax benefit from 2009 is primarily due to an increase in profitability, partially offset by higher energy tax credits generated in the United States in 2010 from the production of certain eligible energy efficient appliances and higher BEFIEX credits recognized in Brazil. The reduction in tax benefit from 2008 to 2009 was primarily due to an increase in profitability, changes in dispersion of global income and the unfavorable impact of audits and settlements in 2009.
Net Earnings Available to Whirlpool
Net earnings available to Whirlpool increased $291 million compared to 2009 to $619 million or $7.97 per diluted share. The increase was primarily due to cost reductions and improved productivity, $156 million higher BEFIEX credits recognized, higher energy tax credits and higher volumes, partially offset by unfavorable product price/mix and higher material and oil-related costs.
FORWARD-LOOKING PERSPECTIVE
For 2011, we currently estimate earnings per diluted share to be in the range of $12.00 to $13.00, and free cash flow to be in the range of $400 million to $500 million. This outlook includes $200 million, or approximately $2.60 per diluted share, of BEFIEX credits and $300 million, or approximately $4.00 per diluted share, of United States energy tax credits, that we expect to earn during 2011. Our estimate of free cash flow includes contributions to our United States pension plans of approximately $300 million. The energy tax credits are not expected to be monetized during 2011. In North America we expect industry demand to increase 2–3% and in Latin America we expect industry demand to increase 5–10%. In Europe and Asia we expect industry demand to increase 2–4% and 6–8%, respectively. Inflation is expected to increase material costs by approximately $250 million to $300 million, largely driven by increases in component parts, steel and base metals, such as copper, aluminum, zinc and nickel. We expect to offset these higher costs with productivity improvements and new product introductions. Our innovation product pipeline continues to grow, consumer and trade response to our new product offerings has been positive and we continue to accelerate our global branded consumer products strategy of delivering relevant innovation to markets worldwide.
The table below reconciles projected 2011 cash provided by operations determined in accordance with generally accepted accounting principles in the United States (GAAP) to free cash flow, a non-GAAP measure. Management believes that free cash flow provides stockholders with a relevant measure of liquidity and a useful basis for assessing Whirlpool’s ability to fund its activities and obligations. There are limitations to using non-GAAP financial measures, including the difficulty associated with comparing companies that use similarly named non-GAAP measures whose calculations may differ from our calculations. We define free cash flow as cash provided by continuing operations after capital expenditures and proceeds from the sale of assets/businesses.
These projections are based on many estimates and are inherently subject to change based on future decisions made by management and the Board of Directors of Whirlpool, and significant economic, competitive and other uncertainties and contingencies.
| (Millions of dollars) | 2011 Outlook | |||||
|---|---|---|---|---|---|---|
| Cash provided by operating activities | $ | 1,000 | – | $ | 1,100 | |
| Capital expenditures | (600) | – | (650 | ) | ||
| Proceeds from sale of assets/businesses | — | – | 50 | |||
| Free cash flow | $ | 400 | – | $ | 500 | |
FINANCIAL CONDITION AND LIQUIDITY
Our objective is to finance our business through operating cash flow and the appropriate mix of long-term and short-term debt. By diversifying the maturity structure, we avoid concentrations of debt, reducing liquidity risk. We have varying needs for short-term working capital financing as a result of the nature of our business. The volume and timing of refrigeration and air conditioning sales impacts our cash flows as we increase inventory to meet increased demand in the summer months.
We have experienced negative global economic trends in recent quarters. To succeed in this environment we have recently announced price increases and have aggressively taken steps to further reduce all areas of cost, production capacity and working capital. We believe that operating cash flow, together with access to sufficient sources of liquidity, will be adequate to meet our ongoing requirements to fund our operations.
Our cash flow priorities for the business in the near term are focused on returning our credit ratings to pre-recession levels. During 2010, we paid down approximately $400 million in debt while funding our capital expenditures, pension and maintaining our dividend. Over the next 15 months, we have $650 million in debt maturities and expect to make a cash pension contribution of approximately $300 million. We may begin to look at addressing a portion of our maturities over the next 15 months as part of our normal capital structure review.
Overall, however, our cash flow and credit rating priorities remain unchanged from our previous priorities and we will continue to prioritize our cash flow accordingly.
Sources and Uses of Cash
We expect to meet our cash needs for 2011 from cash flows from operations, cash and equivalents and financing arrangements. Our cash and equivalents were $1.4 billion at December 31, 2010 and 2009.
Cash Flows from Operating Activities
Cash provided by operating activities in 2010 was $1,078 million, a decrease of $472 million compared to 2009. The reduction in cash provided by operations primarily resulted from required increases in inventory to support product availability and product transitions, partially offset by higher net earnings and more favorable terms of collection of accounts receivable and of payment to suppliers. In addition, the significant slowing of sales growth in the second half resulted in higher than normal inventory levels of approximately three days. Cash provided by operating activities in 2009 was $1,550 million, an increase of $1,223 million compared to 2008. Cash provided by operations in 2009 included lower payments for inventory, lower cash payments for accounts payable and other operating accruals and lower employee compensation payments, partially offset by lower collections of accounts receivable.
Whirlpool offers our suppliers access to a payables presentment and settlement service (“PPS”) provided by a third party processor. This service allows our suppliers to view scheduled Whirlpool payments online, enabling them to better manage their cash flow and reduce payment processing costs. Independent of Whirlpool, the PPS provider also allows suppliers to sell their receivables to financial institutions at the sole discretion of both the supplier and the financial institution. We have no economic interest in the sale of these receivables and no direct relationship with financial institutions concerning this service. All of our obligations, including amounts due, remain to our suppliers as stated in our supplier agreements. At 2010, approximately $272 million has been sold by suppliers to participating financial institutions, compared to $145 million in 2009. If the PPS provider or participating financial institutions were no longer willing or able to purchase the receivables from our suppliers, the suppliers may seek to renegotiate supply terms with us, which may affect the timing of our cash flows.
In September 2009, we entered into a settlement agreement with the Brazilian competition commission that requires us to make payments totaling 100 million Brazilian reais. The payments are to be made in twelve equal semiannual installments of approximately $5 million through 2015, totaling approximately $56 million. As of December 31, 2010, approximately $15 million of this amount had been paid.
In September 2010, we entered into a plea agreement with the United States Department of Justice that requires us to pay a fine totaling $91.8 million to the United States government. The amount will be paid in one initial installment of $16.8 million plus accrued interest and five additional annual installments of $15 million each, plus accrued interest. The first installment of $16.8 million plus accrued interest was paid in January 2011.
Cash Flows from Investing Activities
Cash used in investing activities in 2010 was $606 million, an increased outflow of $107 million compared to 2009. The increase in cash used in investing activities was primarily due to increased capital spending to support new products and innovation, the purchase of a brand and lower proceeds from the sale of assets. Cash used in investing activities in 2009 was $499 million compared to an outflow of $433 million in 2008. The increase in cash used in investing activities in 2009 was primarily due to lower proceeds from the sale of assets in 2009 and higher investments primarily associated with business acquisition activity in our international locations.
The goal of our global operating platform is to enhance our competitive position in the global home appliance industry by reducing costs, driving productivity and quality improvements, and accelerating our rate of innovation. We plan to continue our comprehensive worldwide effort to optimize our regional manufacturing facilities, supply base, product platforms and technology resources to better support our global products, brands and customers. We intend to make additional investments to improve our competitiveness in 2011, including capital spending of between $600 and $650 million.
Cash Flows from Financing Activities
Cash used in financing activities in 2010 was $495 million compared to a $144 million inflow in 2009. The decrease was primarily due to a decrease in proceeds from long-term borrowings and the repayment of long-term debt. During 2010, we repaid $379 million of long-term debt and reduced short-term debt by $20 million. In addition, we paid dividends to common stockholders totaling $132 million, and received proceeds from the issuance of common stock related to option exercises of $72 million.
Cash provided by financing activities in 2009 was an inflow of $144 million compared to an inflow of $141 million in 2008. Cash provided by financing activities in 2009 includes proceeds received related to two debt offerings totaling $850 million while 2008 includes proceeds received related to the issuance of $500 million of 5.5% notes due March 1, 2013. In addition, 2009 includes net repayments of short-term borrowings and long-term debt repayments totaling $572 million compared to net repayments of $30 million in 2008. During 2009, we paid dividends to common stockholders totaling $128 million, paid debt financing fees of $38 million and received proceeds from the issuance of common stock related to option exercises of $21 million. During 2008, we repurchased stock totaling $247 million, paid dividends to common stockholders totaling $128 million and received proceeds from the issuance of common stock related to option exercises of $21 million.
Financing Arrangements
We have a $1.35 billion committed credit facility maturing on August 13, 2012 which includes a $200 million letter of credit sub-facility. Borrowings under the credit facility are available to us and designated subsidiaries for general corporate purposes, including commercial paper support. Subsidiary borrowings under this facility, if any, are guaranteed by Whirlpool Corporation. Interest under the credit facility accrues at a variable annual rate based on LIBOR plus a margin or the prime rate plus a margin. The margin is dependent on our credit rating at that time. The credit facility requires us to meet certain leverage and interest coverage requirements. We will incur a commitment fee for any unused portion of the credit facility which is based on Whirlpool’s credit rating. At December 31, 2010 and 2009, we had no borrowings outstanding under this credit agreement and are in compliance with financial covenant requirements.
We also had a $522 million committed credit facility which expired on December 1, 2010. At the expiration date and at December 31, 2009, we had no borrowings outstanding under this credit agreement and were in compliance with financial covenant requirements.
In 2009, we completed a debt offering comprised of (1) $350 million aggregate principal amount of 8.0% notes due May 1, 2012 and (2) $500 million aggregate principal amount of 8.6% notes due May 1, 2014. If we experience a downgrade in our credit ratings, the notes are subject to an increase in the interest rate, resulting in higher interest payments. The notes contain customary covenants that limit our ability to incur certain liens or enter into certain sale and lease-back transactions. In addition, if we experience a specific kind of change of control, we are required to make an offer to purchase all of the notes at a purchase price of 101% of the principal amount thereof, plus accrued and unpaid interest.
MARKET RISK
We have in place an enterprise risk management process that involves systematic risk identification and mitigation covering the categories of enterprise, strategic, financial, operation and compliance and reporting risk. The enterprise risk management process receives Board of Directors and management oversight, drives risk mitigation decision-making and is fully integrated into our internal audit planning and execution cycle.
We are exposed to market risk from changes in foreign currency exchange rates, domestic and foreign interest rates, and commodity prices, which can affect our operating results and overall financial condition. We manage exposure to these risks through our operating and financing activities and, when deemed appropriate, through the use of derivative financial instruments. Derivative financial instruments are viewed as risk management tools and are not used for speculation or for trading purposes. Derivative financial instruments are generally contracted with a diversified group of investment grade counterparties to reduce exposure to nonperformance on such instruments.
We use foreign currency forward contracts, currency options and currency swaps to hedge the price risk associated with firmly committed and forecasted cross-border payments and receipts related to ongoing business and operational financing activities. Foreign currency contracts are sensitive to changes in foreign currency exchange rates. At December 31, 2010, a 10% favorable or unfavorable exchange rate movement in each currency in our portfolio of foreign currency contracts would have resulted in an incremental unrealized gain or loss of approximately $175 million, respectively. Consistent with the use of these contracts to neutralize the effect of exchange rate fluctuations, such unrealized losses or gains would be offset by corresponding gains or losses, respectively, in the re-measurement of the underlying exposures.
We enter into commodity swap contracts to hedge the price risk associated with firmly committed and forecasted commodities purchases, the prices of which are not fixed directly through supply contracts. As of December 31, 2010, a 10% favorable or unfavorable shift in commodity prices would have resulted in an incremental gain or loss of approximately $50 million, respectively, related to these contracts.
In January 2009, Standard & Poor’s and Fitch Ratings lowered our senior unsecured debt rating from “BBB” to “BBB-” and our short-term corporate credit and commercial paper ratings from “A-2” to “A-3” and “F-2 to F-3”, respectively, based on weakened operating performance and the pullback in discretionary consumer spending. Also in January 2009, Moody’s Investor Services lowered our senior unsecured rating from “Baa2” to “Baa3” and our commercial paper ratings from “Prime-2” to “Prime-3” based on weakening appliance industry demand. These rating adjustments may result in higher interest costs if we were to seek additional financing in the capital markets.
FORWARD-LOOKING STATEMENTS
This document contains forward-looking statements about Whirlpool Corporation and its consolidated subsidiaries (“Whirlpool”) that speak only as of this date. Whirlpool disclaims any obligation to update these statements. Forward-looking statements in this document may include, but are not limited to, statements regarding expected earnings per share, cash flow, productivity and material and oil-related prices. Many risks, contingencies and uncertainties could cause actual results to differ materially from Whirlpool’s forward-looking statements. Among these factors are: (1) intense competition in the home appliance industry reflecting the impact of both new and established global competitors, including Asian and European manufacturers; (2) Whirlpool’s ability to continue its relationship with significant trade customers and the ability of these trade customers to maintain or increase market share; (3) changes in economic conditions which affect demand for our products, including the strength of the building industry and the level of interest rates; (4) product liability and product recall costs; (5) litigation and legal compliance risk and costs, especially costs which may be materially different from the amount we expect to incur or have accrued for; (6) the effects and costs of governmental investigations or related actions by third parties; (7) the ability of Whirlpool to manage foreign currency fluctuations; (8) global, political and/or economic uncertainty and disruptions, especially in Whirlpool’s significant geographic regions, including uncertainty and disruptions arising from natural disasters or terrorist attacks; (9) the ability of Whirlpool to achieve its business plans, productivity improvements, cost control, leveraging of its global operating platform, and acceleration of the rate of innovation; (10) inventory and other asset risk; (11) fluctuations in the cost of key materials (including steel, oil, plastic, resins, copper and aluminum) and components and the ability of Whirlpool to offset cost increases; (12) the ability of suppliers of critical parts, components and manufacturing equipment to deliver sufficient quantities to Whirlpool in a timely and cost-effective manner; (13) health care cost trends, regulatory changes and variations between results and estimates that could increase future funding obligations for pension and post retirement benefit plans; (14) Whirlpool’s ability to obtain and protect intellectual property rights; (15) information technology system failures and data security breaches; (16) the impact of labor relations; (17) our ability to attract, develop and retain executives and other qualified employees; and (18) changes in the legal and regulatory environment including environmental and health and safety regulations. Additional information concerning these and other factors can be found in Whirlpool Corporation’s filings with the Securities and Exchange Commission, including the most recent annual report on Form 10-K, quarterly reports on Form 10-Q and current reports on Form 8-K.
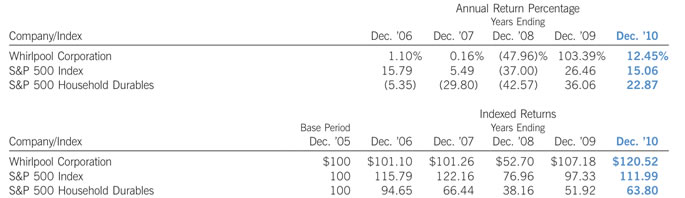
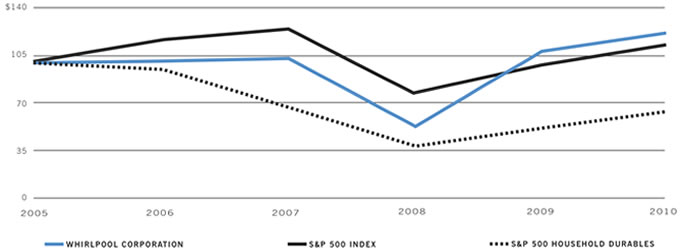
PERFORMANCE GRAPH
The graph below depicts the yearly dollar change in the cumulative total stockholder return on our common stock with the cumulative total return of Standard & Poor’s (S&P) Composite 500 Stock Index and the cumulative total return of the S&P 500 Household Durables Index for the years 2006 through 2010.* The graph assumes $100 was invested on December 31, 2005, in Whirlpool common stock, the S&P 500 and the S&P Household Durables Index.
* Cumulative total return is measured by dividing (1) the sum of (a) the cumulative amount of the dividends for the measurement period, assuming dividend reinvestment, and (b) the difference between share price at the end and at the beginning of the measurement period by (2) the share price at the beginning of the measurement period.
Total Return to Shareholders
(Includes reinvestment of dividends)